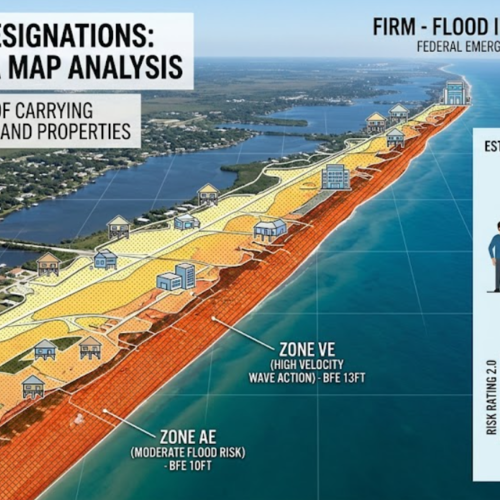





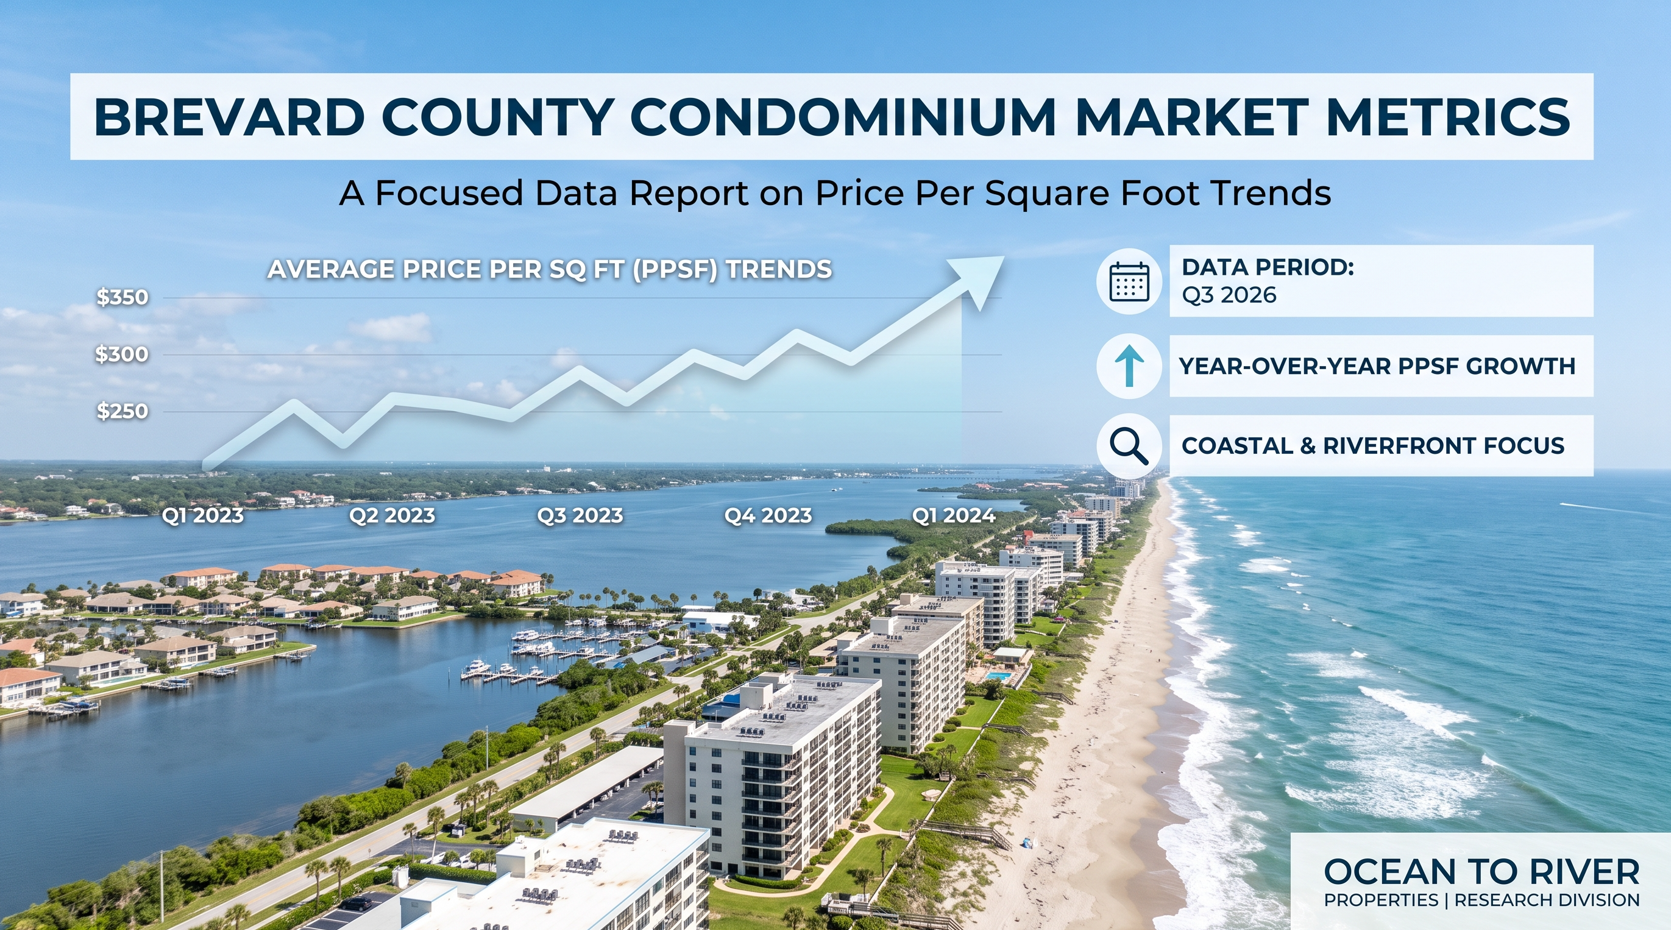
This executive summary looks at the present-day condominium inventory figures, with a particular focus on Price Per Square Foot (PPSF) assessments in Brevard County and in the neighbouring coastal areas as of the third quarter of 2026. Through an examination of recent transaction data, the number of properties currently on the market, and changes in prices from one year to the next, the study offers an impartial overview of the coastal multi-family residential sector.
Methodology and Scope
The methodology and scope of the study are based on data gathered from recently completed sales, currently pending transactions, and properties that are still listed for residential condominiums located along the immediate coast (that is, the barrier islands) and those situated on the riverfront. In order to standardise the assessment of property values, the main metric used is Price Per Square Foot (PPSF), this allowing the comparative analysis to be carried out despite the different sizes of the units, the number of bedrooms, and the ages of the buildings. Geographically, the area covered includes Northern Brevard (Cape Canaveral and Cocoa Beach), Southern Brevard (Indialantic and Melbourne Beach), and it extends southward towards the Sebastian coastal area.
1. Regional Price Per Square Foot (PPSF) Averages
The market for coastal condominiums can be divided into separate valuation groups according to where they are situated and whether they are near the Atlantic Ocean or the Indian River Lagoon.
- In the Northern Brevard area (which includes Cape Canaveral and Cocoa Beach) the condominium inventory is at the highest density. The average price per square foot for units with ocean views is currently $415 per square foot, while those without ocean views but located next to the beach have an average of $320 per square foot. The stabilization seen in this market is mainly due to the steady amount of older property (built between the 1970s and 1980s) being subjected to structural and aesthetic modernization, a process which gradually increases the overall price per square foot.
- In the Southern Brevard area, which extends from Indialantic to Melbourne Beach, condos are known for their lower density and more stringent zoning regulations and as a result this sector enjoys a higher price. Valuations for properties on the ocean front amount to an average of $485 per square foot, and new developments are driving the top tenth of the market above $600 per square foot. Riverfront condominiums overlooking the Indian River Lagoon have an average value of $360 per square foot, showing good retention of value because of the limited amount of land available for new development.
- In the areas surrounding the coast, from Sebastian down to Indian River County, the data shows that the average PPSF for units that are close to the coast is higher at $345 per square foot in the Sebastian and North Hutchinson Island areas. This subsection of the market exhibits a wide range of prices, the extent of which is largely determined by the age of the building and its most recent HOA assessment records.
2. Year-over-Year Trend Analysis
An examination of the data for the previous 12 months shows that the rapid rate of price increases which were seen in earlier years is slowing down and the market is now entering a phase of equilibrium.
- The appreciation rate is such that the average PPSF in condominiums in Brevard County has risen by a small amount of 3.2% compared to the same period last year. This shows that the rate of growth is now normalized when compared with the steep spikes of over 10 percentage points seen at the beginning of the decade.
- Time on the market: The days on market (DOM) figure has increased. Condominiums which are priced within a 3% margin of their neighbourhood's historical PPSF are now averaging 42 days before reaching pending status. Those units that are listed above the $500 per square foot level are facing longer DOM, with an average of 74 days, which shows that current buyers are more sensitive to price.
3. The effect of inventory volume on pricing
The connection between active inventory and PPSF is still the main force behind market dynamics.
The number of condominium properties currently on the market in Brevard has risen by 14% when compared with this time last year. This rise in the supply of properties has directly led to the stabilization of the PPSF. Since there are now more choices, buyers have been able to use the greater inventory to haggle and reach prices that are closer to the asking prices, which has in turn reduced the gap between the original list price and the final sale price (the current list-to-close ratio being 96.5%).
In addition, in older buildings which are subject to the required milestone structural inspections and then to special assessments, there have been local decreases in their individual PPSF figures. Buyers are currently reducing the amount of their offers in order to cover the capital contributions they expect to have to make to the condominium reserves, causing the average to be slightly lowered in buildings that are more than 30 years old.
The evidence shows that the market for condominiums in Brevard County and the adjacent coastal areas is functioning in a broadly balanced economic situation. The fact that the Price Per Square Foot figure has stabilised, together with the continuous rise in the amount of available properties, points to a normalisation of the values of the assets. In the future, local factors—namely the age of the building, whether or not it has direct water frontage, and the financial condition of the individual condominium associations—will remain the main factors determining the PPSF premiums for individual units.
If you need information regarding local data requests or particular building analyses, you should get in touch with the research and sales team at Ocean to River Properties.
Check out this article next